
Our Mission
TWHC’s mission is to create and preserve affordable housing across Texas, serving individuals in low- and middle-income households who continue to be priced out of their growing communities.
Across Texas, there is a shortage of rental homes affordable and available to extremely low income households (ELI), whose incomes are at or below the poverty guideline or 30% of their area median income (AMI). Many of these households are severely cost burdened, spending more than half of their income on housing. Severely cost burdened poor households are more likely than other renters to sacrifice other necessities like healthy food and healthcare to pay the rent, and to experience unstable housing situations like evictions.
Key Facts
-
887,927 Or 21%
Renter households that are extremely low income
-
-665,967
Shortage of rental homes affordable and available for extremely low income renters
-
$31,020
Average income limit for 4-person extremely low income household
-
$57,980
Annual household income needed to afford a two-bedroom rental home at HUD's Fair Market Rent.
-
81%
Percent of extremely low income renter households with severe cost burden
Extremely Low Income Rental Households
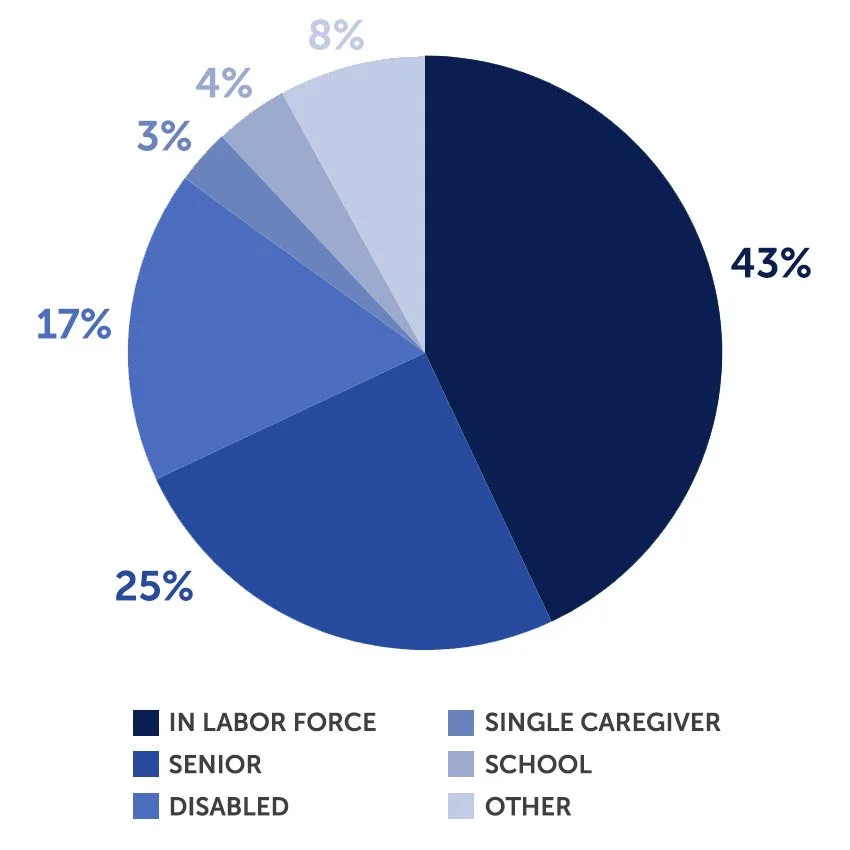
Note: Mutually exclusive categories applied in the following order: senior, disabled, in labor force, enrolled in school, single adult caregiver of a child under 7 or a person with a disability, and other. Thirteen percent of extremely low-income renter households include a single adult caregiver, 53% of whom usually work at least 20 hours per week. Eleven percent of extremely low-income renter householders are enrolled in school, 48% of whom usually work at least 20 hours per week.
Source: 2023 ACS PUMS
Affordable and Available Homes per 100 Renter Households

Source: 2023 ACS PUMS
Housing Income Burden By Income Group

Note: Renter households spending more than 30% of their income on housing costs and utilities are cost burdened; those spending more than half of their income are severely cost burdened.
Source: 2023 ACS PUMS